


Most traders spend months grinding through live demo accounts, waiting days for a single valid setup on a 4-hour chart. It is slow, tedious, and frankly a terrible way to build real skill. PaperTrader flips that model on its head. It drops you into historical market data and lets you replay charts candle by candle, completely blind to what comes next, across crypto, forex, US stocks, indices, and commodities.
What makes it genuinely interesting is not just the replay mechanic. It is the AI Trading Coach sitting underneath all those sessions, quietly collecting data on every decision you make. Once you have enough trades logged, it runs an analysis across your last 50 to 100 trades to surface patterns you probably never noticed yourself.
No signup is required to start. That alone removes most of the friction that kills curiosity.
Key Features of PaperTrader
Blind Candle-by-Candle Chart Replay
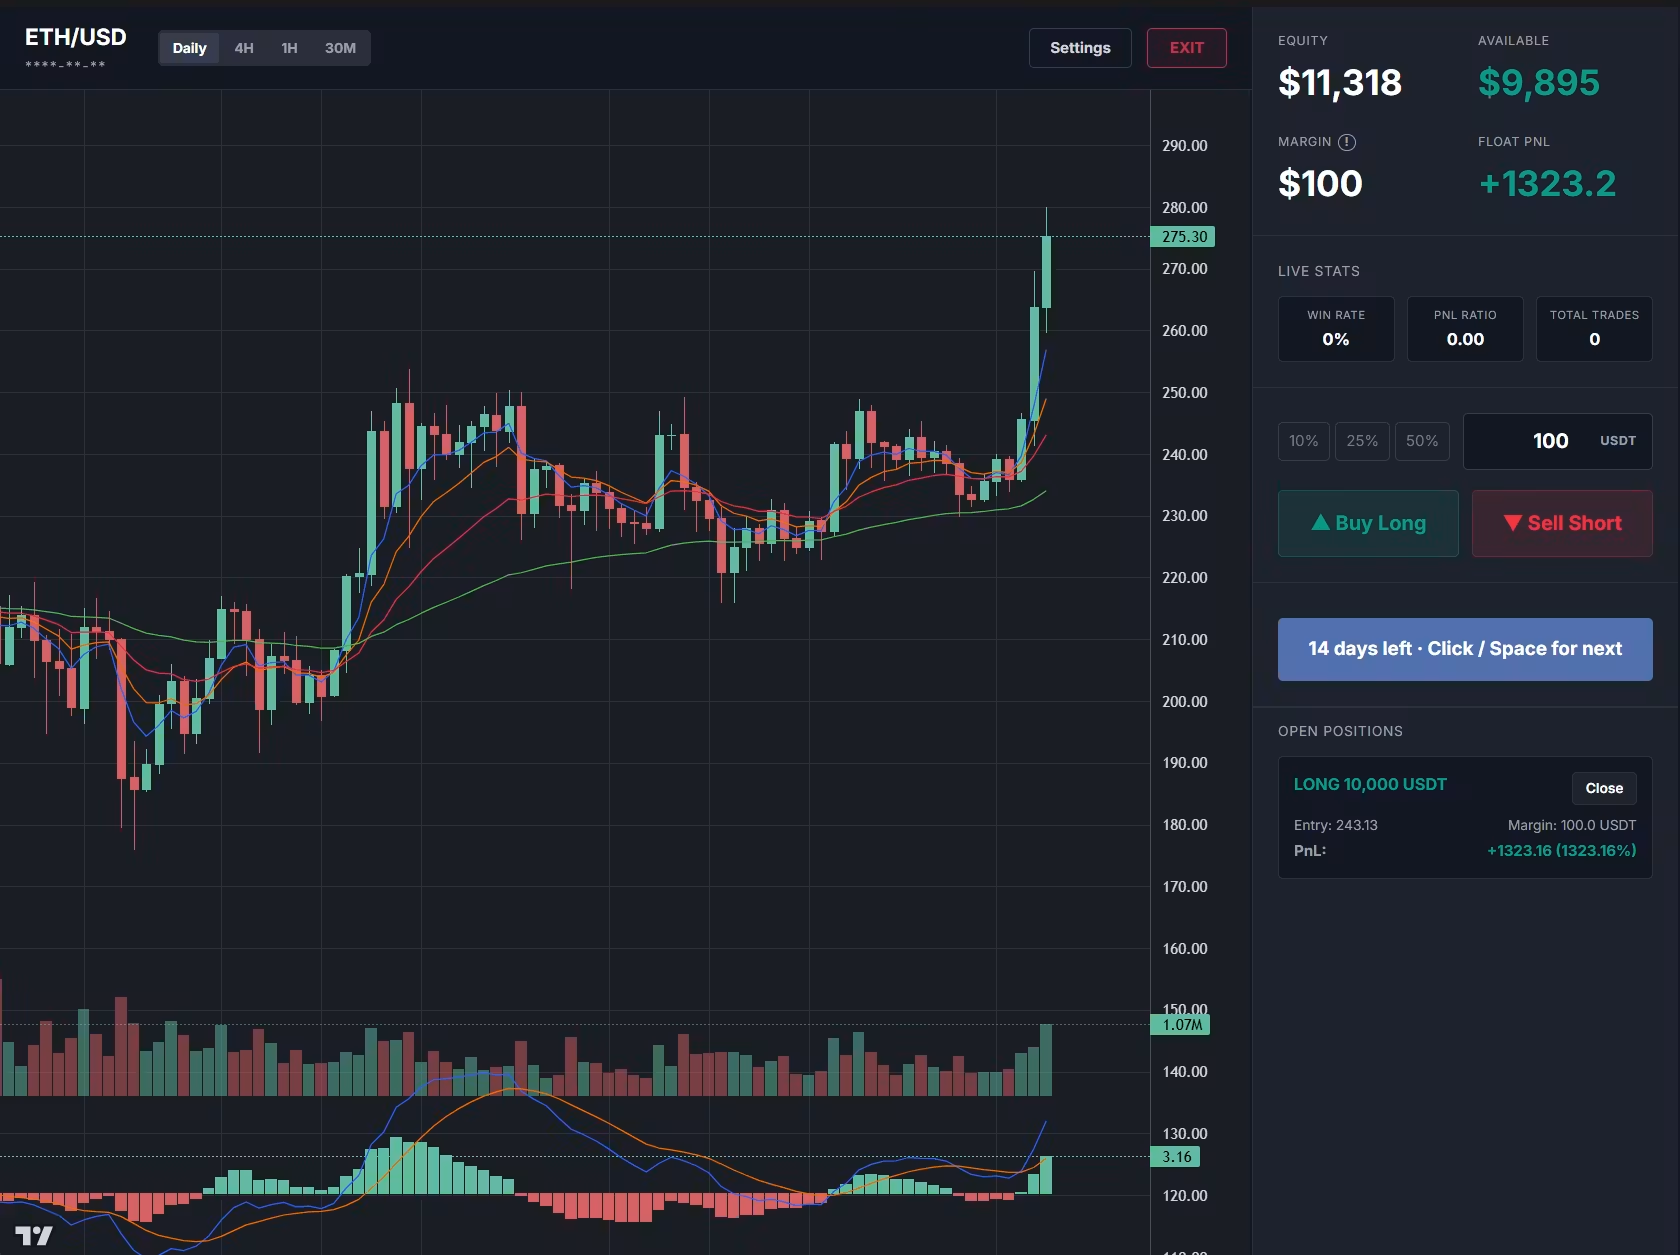
This is the core mechanic and it works exactly how prop firms train new traders. You pick a market, set a start date and simulation length, and the platform drops you into a historical period without telling you what happens next. You click or press space to reveal the next candle. No peeking ahead. No hindsight bias. You trade what you see, just like you would in a live session, except months of price action can be compressed into an hour or two.
AI Trading Coach: Pattern Analysis Across 100 Trades
After enough sessions, the AI Trading Coach pulls your full trade history and looks for hidden combinations. It identifies which setups yield positive returns, which asset-timeframe pairings are quietly dragging your profit factor down, and where your execution is leaking money. The report is structured into four sections: Profitability and Drift Diagnosis, Edge Clusters and Bias, System Score, and actionable suggestions for the next session. It does not guess at your emotions. It reads the data and tells you what the numbers actually say.
Multi-Market Coverage
The platform covers a wide spread of assets: BTC, ETH, SOL, EUR/USD, GBP/USD, USD/JPY, Gold, Crude Oil, US 500, US Tech 100, HK50, popular US stocks, and China A-Shares. Historical data goes back to 2016 for most instruments. That means you can practice through the 2020 oil crash, the 2021 crypto bull run, the 2022 crypto winter, and ECB-driven forex volatility, all in a single afternoon.
Account Statistics and Equity Tracking
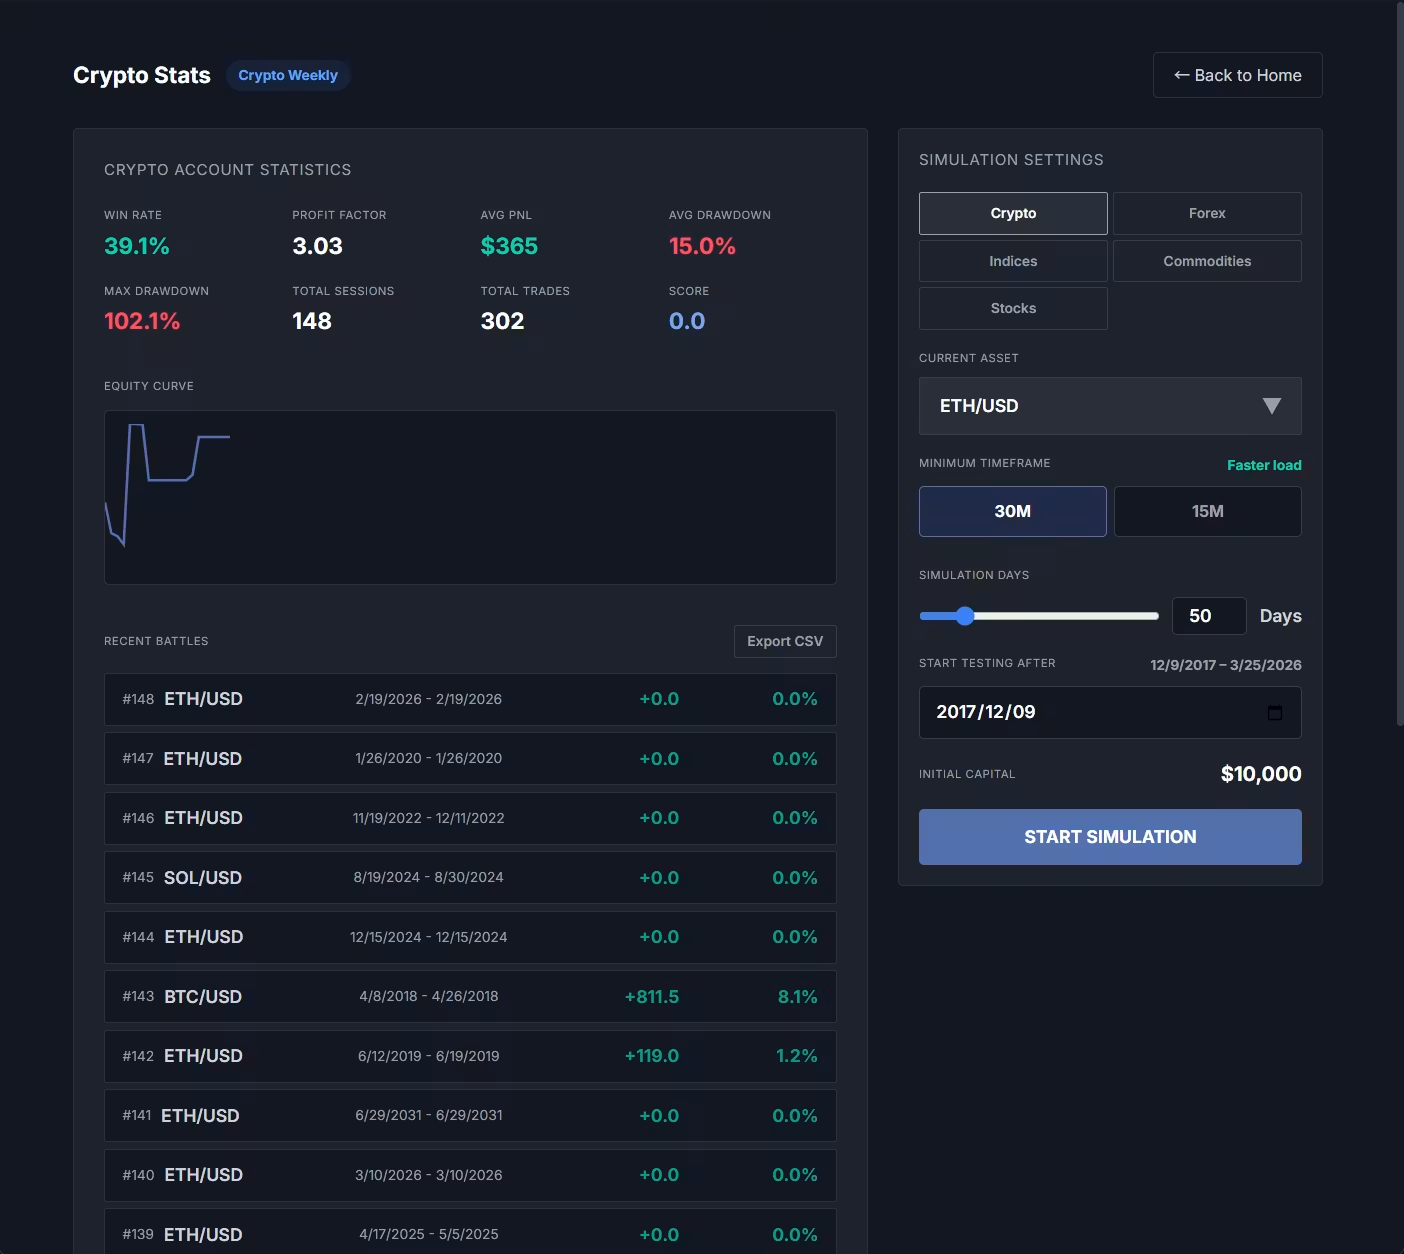
Every session feeds into a persistent stats panel: win rate, profit factor, average PnL, average drawdown, max drawdown, total trades, and a composite score. There is also an equity curve to visualize how your capital would have moved across sessions. Free accounts get one daily CSV export. Paid accounts get permanent cloud storage and unlimited exports, which is useful if you want to run your own analysis on top of the raw data.
Global Leaderboard
For those who want external accountability, there is a leaderboard ranked by score, expectancy multiplier, win rate, and other metrics. It resets weekly and requires a minimum of 10 trades to qualify. It is a small touch, but it adds a layer of competitive structure that keeps things honest.
Marcus at 9pm, Trying to Fix a Losing Streak on EUR/USD
Marcus is a part-time forex trader based in Austin. He had been trading EUR/USD on the 1-hour chart for about eight months and could not figure out why his win rate was stuck around 38 percent despite what he felt were decent entries.
At 9pm on a Tuesday, he opened PaperTrader, selected the Forex simulator, set EUR/USD as the asset, chose a 15-minute minimum timeframe, and started a 60-day historical simulation from a random point in 2019. Over about 45 minutes he made 22 trades.
After a few more sessions brought his total past 80 trades, he triggered the AI Coach report. The output was specific: his short trades during low-volume periods were dragging his profit factor below 1.0, while his long entries during higher-volatility sessions had a profit factor above 2.3. He had been treating all his setups equally. The AI showed him they were not even close to equal.
The next session, Marcus filtered to only the conditions the AI flagged as his actual edge. His simulated win rate that session was 61 percent. Not a fluke, a pattern he had missed for months.
How a PaperTrader Session Actually Works
Step 1: Choose Your Market and Configure the Simulation
From the home screen, pick any market category. Select your asset, set a minimum timeframe, choose how many simulation days to cover, and set an initial capital amount (default is $10,000). Then hit Start Simulation.
Step 2: Trade Blind, Candle by Candle
The chart loads at your chosen historical start point. You see only what has already happened up to that candle. Click or press space to reveal the next one. Place long or short orders as you see fit. Your equity updates in real time as the simulation progresses.
Step 3: Review Your Stats and Call the AI Coach
After the session ends, your results are logged to your account statistics. Once you have accumulated 50 to 100 trades, the AI Coach section becomes meaningful. Trigger the analysis and the platform generates a structured report covering your strengths, weaknesses, and specific suggestions for your next session.
PaperTrader Pricing
There are three tiers:
- Essential (Free): 3 daily simulated trades per category, standard indicators, 1 weekly AI Coach report, 1 daily CSV export
- Plus (Monthly): $19.90/month. Unlimited trades and instruments, all timeframes, advanced indicators, permanent cloud storage, unlimited CSV exports, priority support
- Premium (Yearly): $199/year. Everything in Plus at a lower per-month cost
The free tier is genuinely usable for getting started, though the 3-trade daily limit will feel restrictive once you get hooked on the replay mechanic.
Who Should Try PaperTrader
If you are new to trading and want real screen time without real losses, this is a practical starting point. If you are an intermediate trader trying to identify exactly where your strategy breaks down across different assets or timeframes, the AI Coach report is worth the time to accumulate the trade history it needs. Head over to paper-trader.org and start a session without creating an account first. See if the blind replay format changes how you think about your own decision-making.