




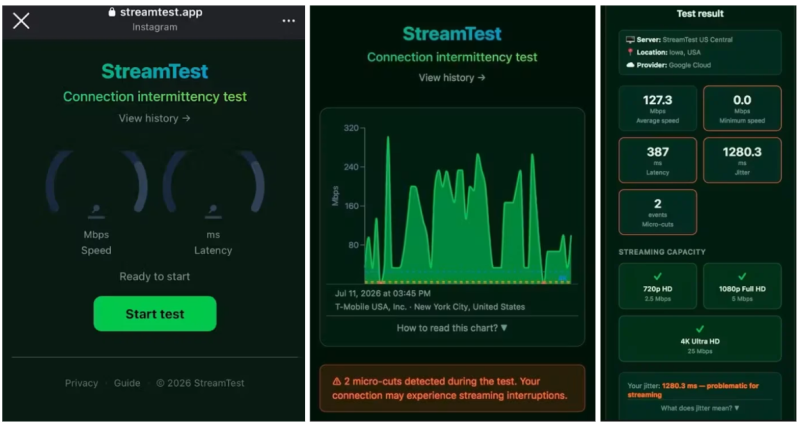
You run a speed test. It shows 80 Mbps. Your stream freezes anyway. Sound familiar? This is the scenario that pushed Juan Guzman, a sports streaming fan, to build StreamTest, a free browser tool that tests your connection the way a live stream actually uses it, not the way a traditional speed test pretends it does.
Standard speed tests give you a single number. That number tells you the peak your connection hit during a brief burst. It says nothing about whether your connection stayed stable for 27 consecutive seconds, which is roughly what a live stream requires to keep playing without stuttering. StreamTest measures exactly that, sampling your throughput every 500ms and flagging any drop below 2.5 Mbps as a real interruption.
It’s free, requires no signup, and runs entirely in your browser. If you’ve ever been told by your ISP that “your speed looks fine” while your soccer match buffers at the worst possible moment, this tool was built for you.
What StreamTest Actually Measures
Real TCP Stream Sampling
StreamTest doesn’t fake it. It downloads a real TCP stream from the server and samples the throughput every 500 milliseconds across a 27-second test window. That continuous measurement is the key difference. You get a live chart, not a single averaged figure. The green line climbing and dipping across your screen is your actual connection in motion.
The 2.5 Mbps Interruption Threshold
When throughput dips below 2.5 Mbps, the chart line turns red. Each red dip counts as a detected signal interruption. The threshold isn’t arbitrary: 2.5 Mbps is roughly what a 720p stream needs to keep playing without freezing. The tool also marks 5 Mbps for 1080p and 25 Mbps for 4K, so you can see at a glance whether your connection is actually hitting the floor your stream quality requires.
Micro-Cut Detection
This is where StreamTest earns its keep. Traditional speed tests miss micro-cuts entirely because they average everything out. StreamTest catches those brief, sub-second drops that never register on a standard test but are more than long enough to cause a buffer event on a live stream. Multiple users on Product Hunt noted that the 500ms sampling caught drops they had never spotted before, drops that explained years of frustrating freezes.
Test History and Repeatable Diagnostics
The tool saves your test history locally. That matters because connection quality varies by hour. A single clean result at 10am says nothing about what happens during peak evening hours when your neighbors are all streaming. Running tests across morning, afternoon, and night gives you a real picture of your ISP’s consistency across the day.
Marcos Finds the Culprit Before the Second Half
Marcos Delgado, a 34-year-old freelance designer based in Madrid, had complained to his ISP three times about stream freezes during Champions League matches. Each time, the support agent pulled up his speed test history, pointed to 75 Mbps, and closed the ticket.
At 8:45pm on a Tuesday, just before kickoff, Marcos ran StreamTest for the first time. The chart started green, oscillating normally around 40 Mbps. Then, at the 14-second mark, the line plunged into red. It recovered quickly, but a second dip followed at the 21-second mark. Two detected interruptions in a single 27-second window.
He took a screenshot of the chart and sent it to his ISP with a clear note: not a speed complaint, a stability complaint, with timestamps. His ISP sent a technician within 48 hours. A corroded junction box outside his building was identified and replaced. The next Champions League match played through without a single freeze.
That screenshot was the proof he never had before.
How to Run a StreamTest Diagnosis
Step 1: Prepare Your Environment
Close all other apps and pause any background downloads. Move closer to your router if you’re on WiFi, or plug in via Ethernet to isolate whether the issue is the WiFi signal or the actual line coming into your building.
Step 2: Run the Test
Head to streamtest.app and hit Start Test. Watch the green line across 27 seconds. Normal TCP behavior includes regular oscillations up and down. What you’re watching for is the line turning red, which signals a real drop below the streaming threshold.
Step 3: Read the Chart
The dashed lines mark your quality floors: 2.5 Mbps, 5 Mbps, and 25 Mbps. Any drop below the floor relevant to your stream quality counts as an interruption. The guide page on the site includes annotated examples showing normal oscillation versus genuine micro-cuts, which helps if you’re unsure what you’re looking at.
Step 4: Repeat Across Different Times
Run the test at multiple points in the day. If your freezes happen at 9pm, test at 9pm. A clean morning result means nothing for an evening problem. The history page lets you compare results side by side.
Who Should Be Using This
StreamTest is most useful for sports streamers, remote workers on video calls, and anyone who has been told by their ISP that their speed is fine despite regular freezes. It’s also a genuinely useful first step before calling technical support, because arriving with a chart showing timestamped drops is a very different conversation than arriving with a complaint about buffering.
It’s free, no account required, and takes under a minute to run. Try it at streamtest.app before your next match, meeting, or movie night. Your speed test has been lying to you. Now you have something better.